LABVIEW
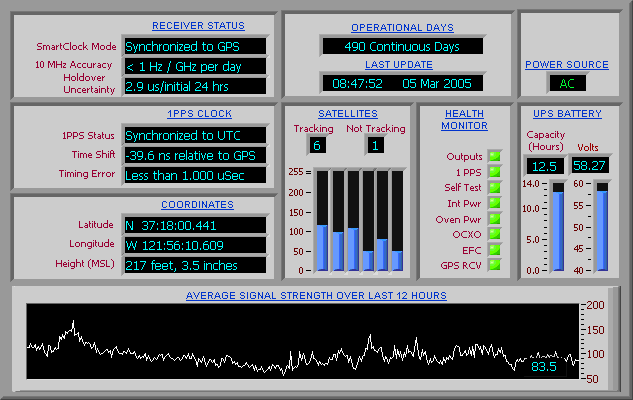
I created this LabVIEW application (a “VI”, or “Virtual Instrument”) in LabVIEW, to monitor my GPS Disciplined Clock.
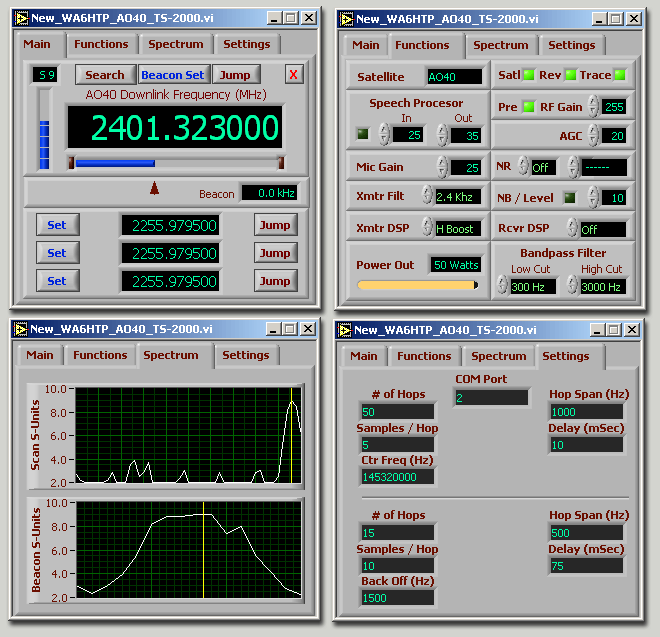
This VI controlled my TS-2000 Transceiver and did the math to show my operating frequency while working the AO-40 Satellite. As you can see, it also did much more, but you get the idea…
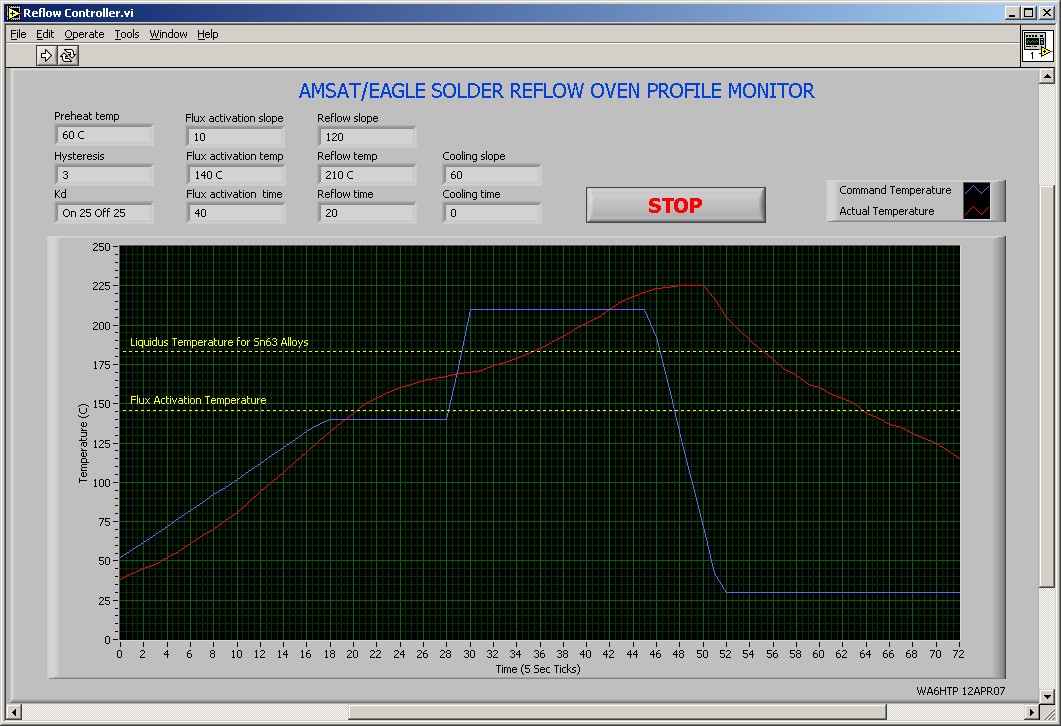
AMSAT/EAGLE SOLDER REFLOW OVEN PROFILE MONITOR – The blue line is the ideal temperature profile. The red line is the actual temperature vs time readings, (The oven is a converted Toaster Oven!
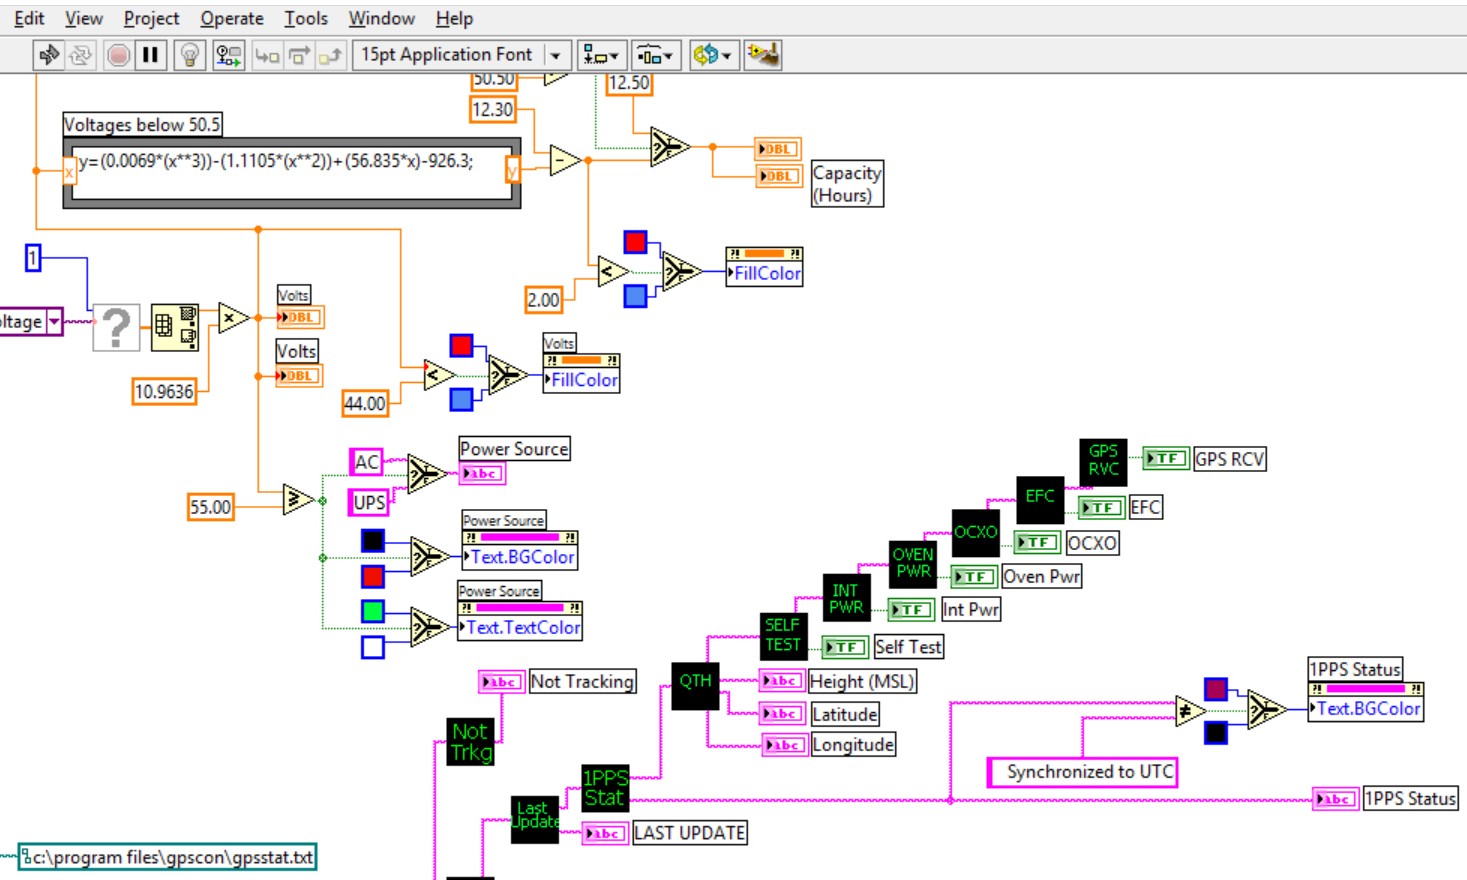
This is a small portion of the GPS Monitor code.. It’s an extremely high-level graphical programming environment. Each of those black icons is a “Sub-VI”. a Sub-VI contains a block of code that has been corralled into a logical block. Sub-VI’s can be nested, so the underlying code can be extremely complex and powerful. Each of the colored icons performs a logical function – and gate, comparator, etc. Some are extremely powerful, such as the math box in the upper left. It contains a 2nd order polynomial equation. The “X” value is being inputted on the left, and the output is feeding other logic on the right.
| Cookie | Duration | Description |
|---|---|---|
| cookielawinfo-checbox-analytics | 11 months | This cookie is set by GDPR Cookie Consent plugin. The cookie is used to store the user consent for the cookies in the category "Analytics". |
| cookielawinfo-checbox-functional | 11 months | The cookie is set by GDPR cookie consent to record the user consent for the cookies in the category "Functional". |
| cookielawinfo-checbox-others | 11 months | This cookie is set by GDPR Cookie Consent plugin. The cookie is used to store the user consent for the cookies in the category "Other. |
| cookielawinfo-checkbox-necessary | 11 months | This cookie is set by GDPR Cookie Consent plugin. The cookies is used to store the user consent for the cookies in the category "Necessary". |
| cookielawinfo-checkbox-performance | 11 months | This cookie is set by GDPR Cookie Consent plugin. The cookie is used to store the user consent for the cookies in the category "Performance". |
| viewed_cookie_policy | 11 months | The cookie is set by the GDPR Cookie Consent plugin and is used to store whether or not user has consented to the use of cookies. It does not store any personal data. |